NEW – INDUSTRY BENCHMARKING
Is your website getting you as many leads as other builders?
Your website, benchmarked against every other business in your industry. Every month.
See how your Elevate Building Co. website performed last month
See how your site compares to others in your industry.

INDUSTRY BENCHMARKING
Where would you sit?
You'll see exactly which bracket you're in — and what it means.
Numbers that actually mean something
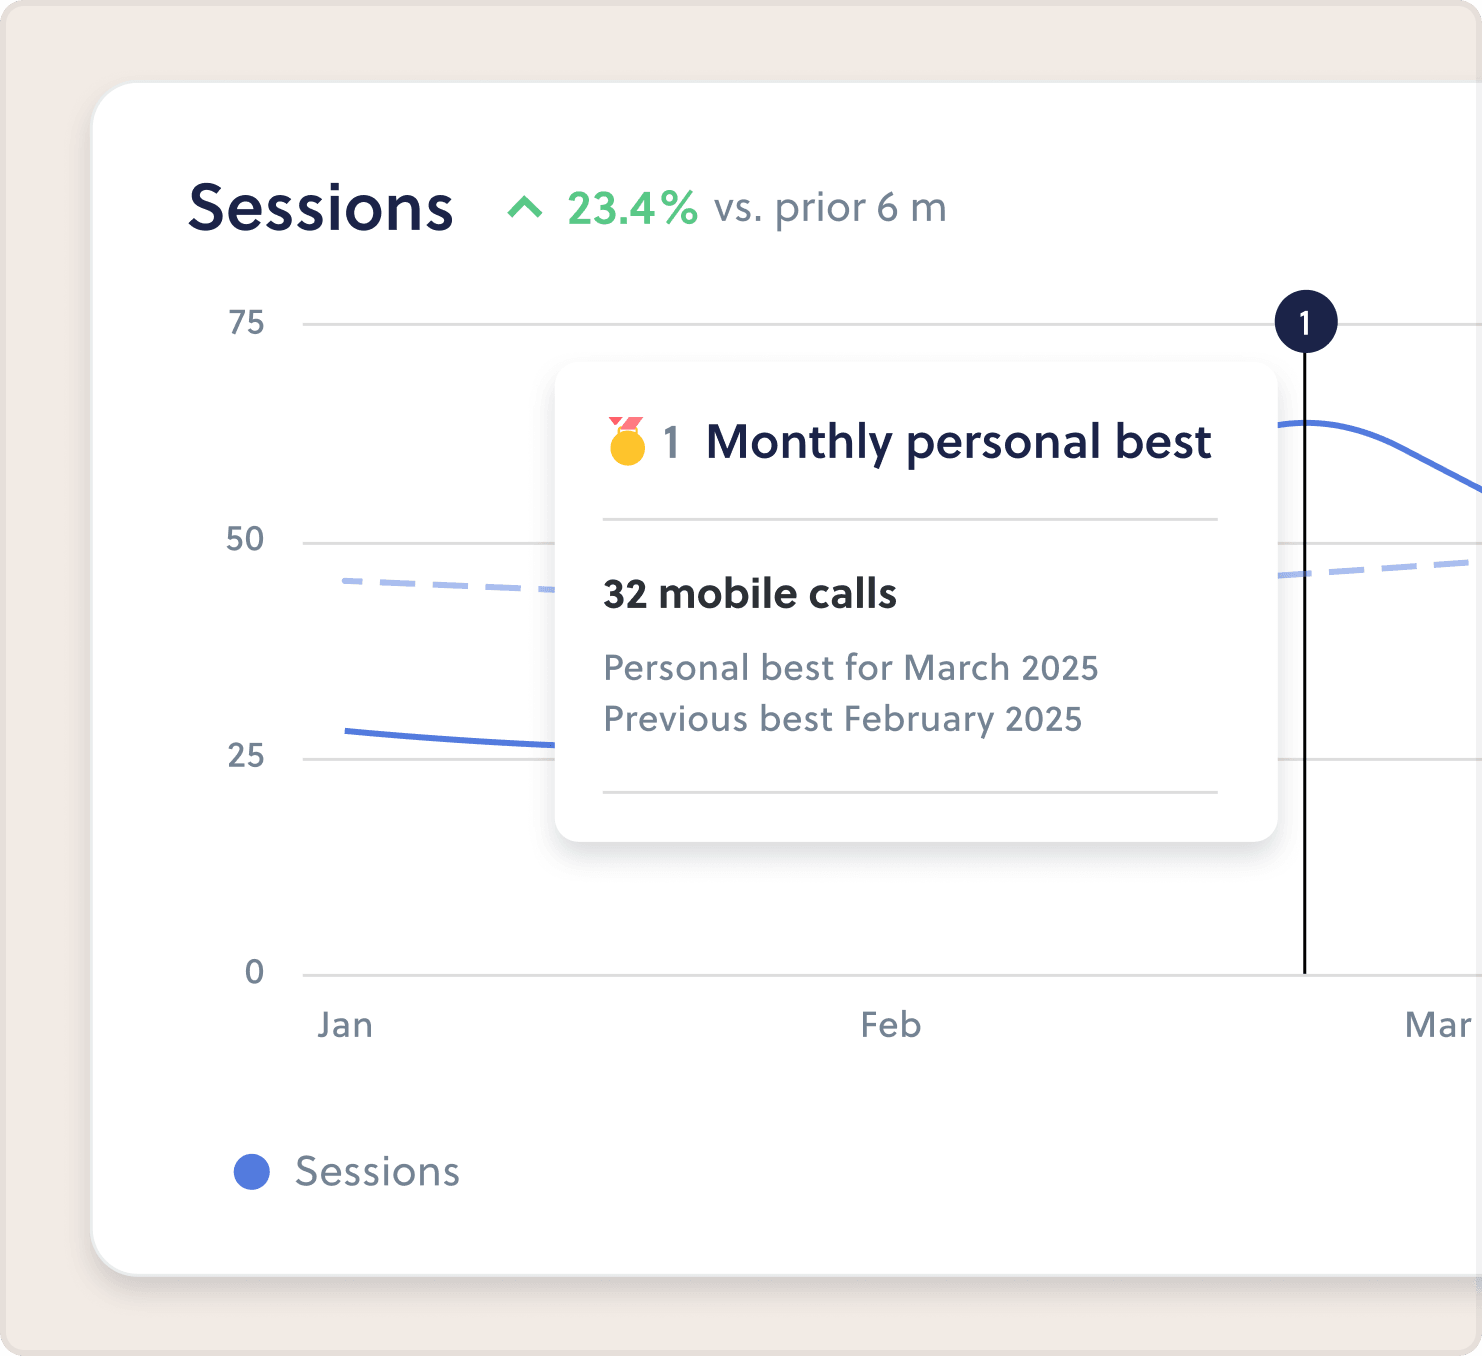
Celebrate every personal best
We detect when you break your own record — most visitors, most calls, most form submissions. Every new personal best is flagged in your email and marked on your dashboard graph.
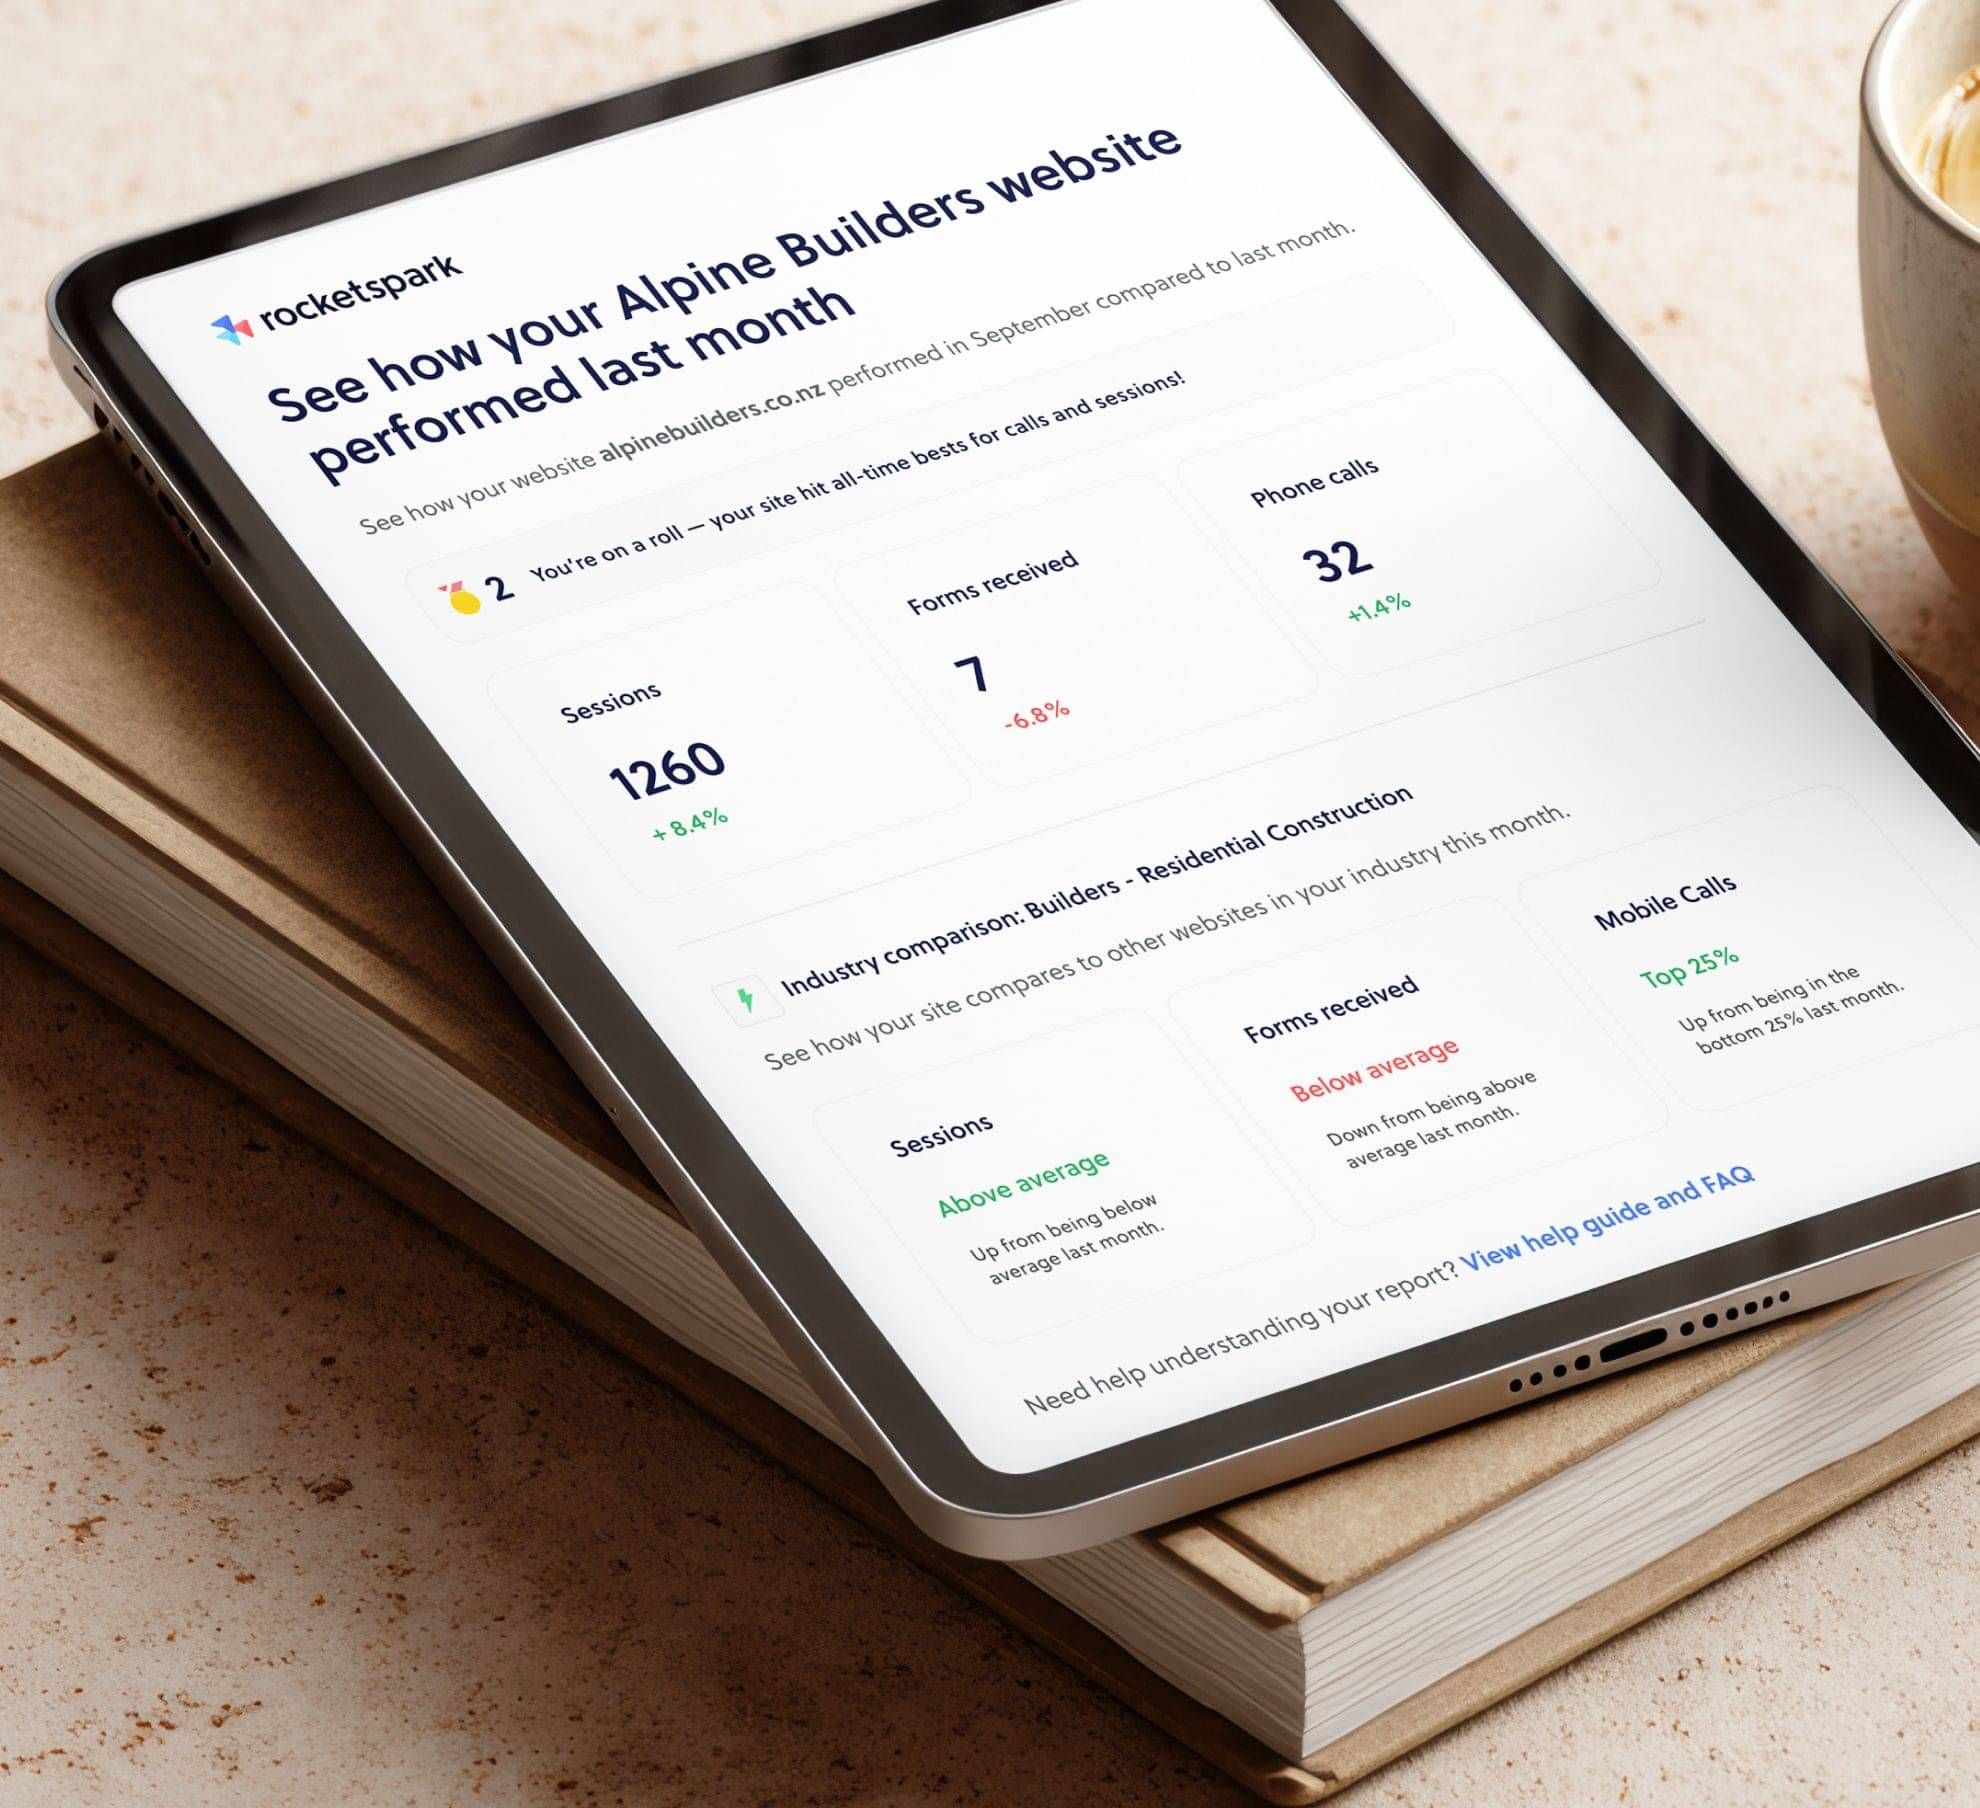
See where you stand in your industry
Are other businesses like yours getting better results? Your monthly email shows whether you're in the top 25%, about average, or have room to grow — across visitors, calls, and forms.
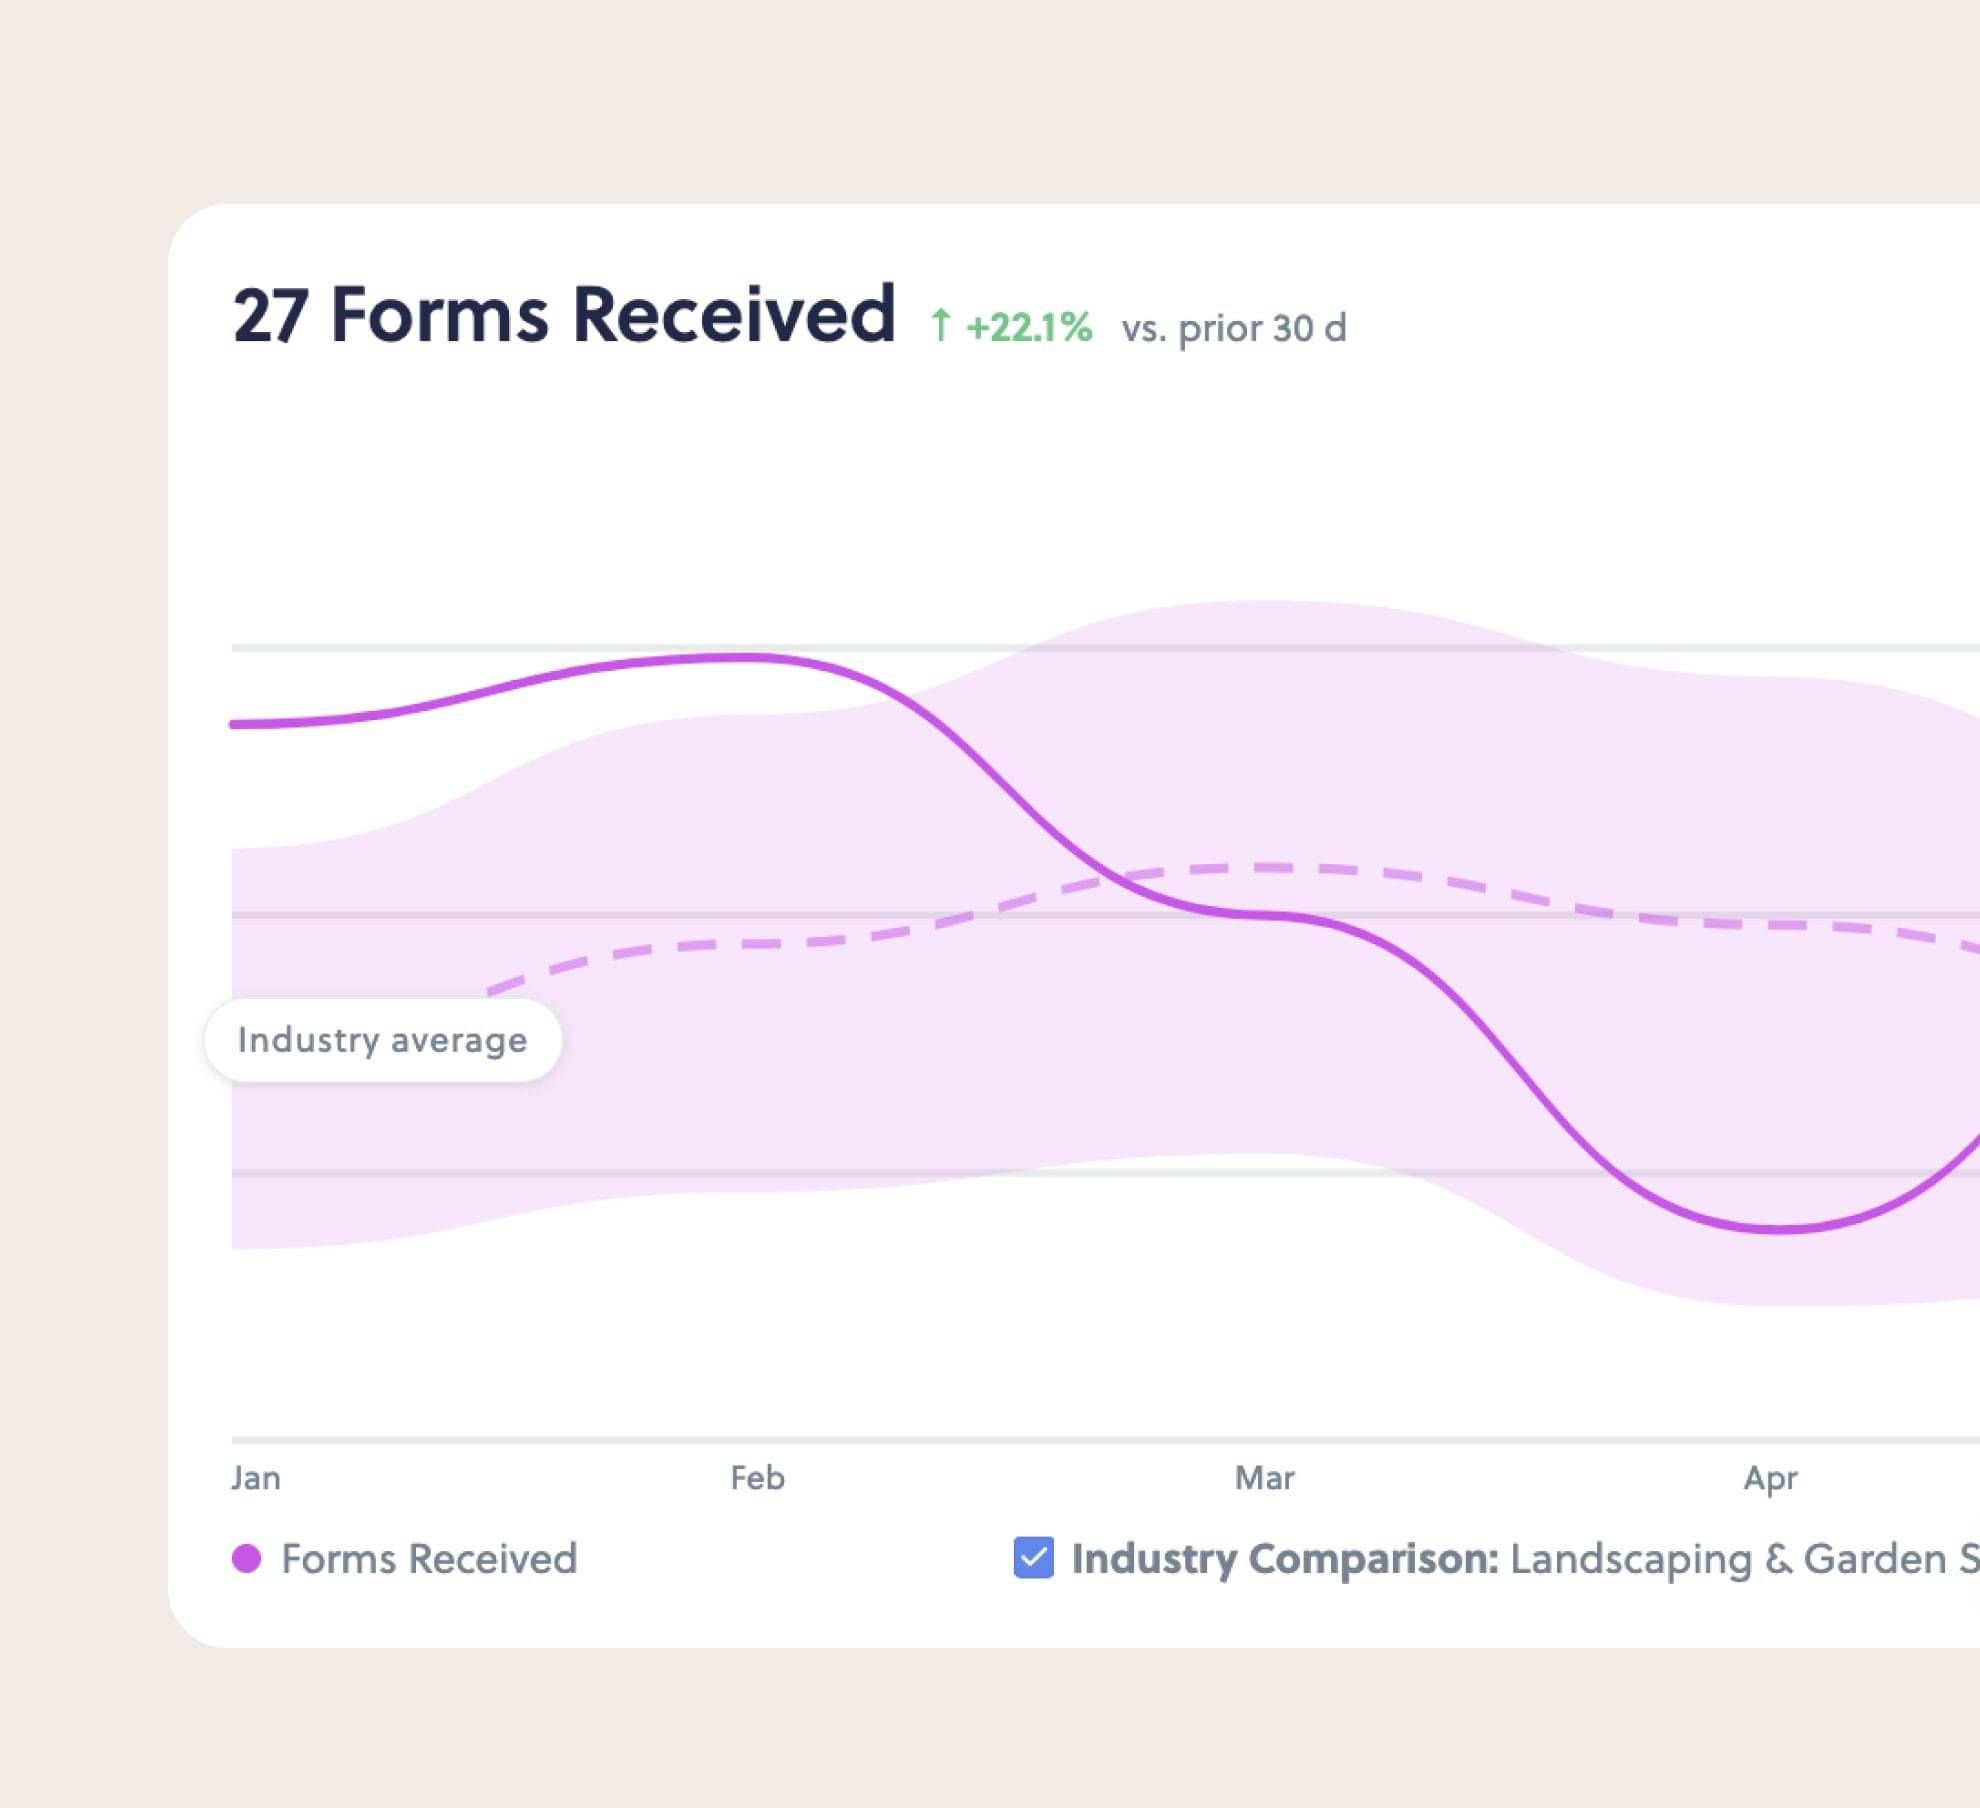
Track your trend on the dashboard
Toggle "Compare to Industry" on your dashboard graph to see your performance line against the industry median over time. Spot whether you're closing the gap — month by month.
What's on your plan
Personal bests come standard. Industry benchmarking unlocks on Pro and above.
ALL PLANS
Know when you're winning
Personal bests tracked on your dashboard graph
Monthly email flags when you break a record
A glimpse of where you sit in your industry
PRO, PRO+, ECOM GROW AND ECOM PRO
Know where you stand
Personal bests tracked on your dashboard graph
Monthly email flags when you break a record
Full industry ranking across visitors, calls & forms
"Compare to Industry" toggle on your dashboard
Track whether you're gaining or falling behind
Not on Rocketspark yet? Start a free trial — benchmarking included.
Where would you sit?
Every month, your visitors, leads, calls, and sales are compared against other Rocketspark businesses in the same industry. You'll see exactly which bracket you're in — and what it means.
Top 25%
Better results than most
Middle 50%
Sitting around the industry average
Room to grow
Could be getting more
Frequently asked questions
How does the comparison work?
We compare your site against other Rocketspark websites in the same industry. We use a weighted average so one very large site doesn't skew results for everyone. Your data is always anonymous.
Why can't I see my industry ranking?
Industry benchmarking is available on Pro, Pro+, Ecom Grow, and Ecom Pro plans. Check our pricing page for the full breakdown.
It's also possible your industry doesn't yet have enough websites for a fair comparison — we'll let you know when it's ready.
Why doesn't it show how I've changed?
Your first month is your starting point. From the second month onwards, you'll see whether you're moving up or down in the rankings compared to previous months.
Why do my dashboard numbers look different to before?
We've aligned your dashboard metrics with your email report so everything matches. You might notice small differences — the data is more accurate now, and sessions, calls, and forms are all counted consistently.
What metrics are included in the benchmarking?
We compare website sessions (visitors), form submissions, mobile calls, and online sales against other Rocketspark businesses in the same industry. We use a trimmed mean so one unusually large or small site doesn't skew the results for everyone.