Ever wished you could watch over a customer’s shoulder while they use your website? Well, you can (without being creepy about it). It’s called Google Analytics, an extremely powerful tool that collects and organises statistics about visitors’ usage of your website.
It’s a bit like the book/film Moneyball. It’s about how one of Major League Baseball’s dud teams became one of the best. How? Statistics. Traditionally, baseball teams relied on a lot of guesswork to make their decisions. But when the Oakland Athletics (2002) defied conventional wisdom and their hunches, applying rigorous statistical analysis instead, they became a winning team. Since then, other teams have jumped on the Moneyball bandwagon, like the Boston Red Sox who won three championships over the past decade as a result—more than any other team during that period. Google Analytics is Moneyball for your business.
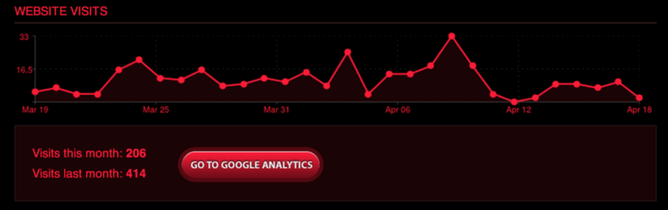
Like other Google services (e.g., Gmail), Analytics is web-based. It’s free to register and to use. To view it at any stage, you just need to visit the Analytics sign-in page. If you’re a Rocketspark customer, we make it even easier for you—it’s accessible directly from your Rocketspark Dashboard, and you can even see a graph of your traffic there too. Find out how to register using our Google Analytics guide.
What can I do with Google Analytics?
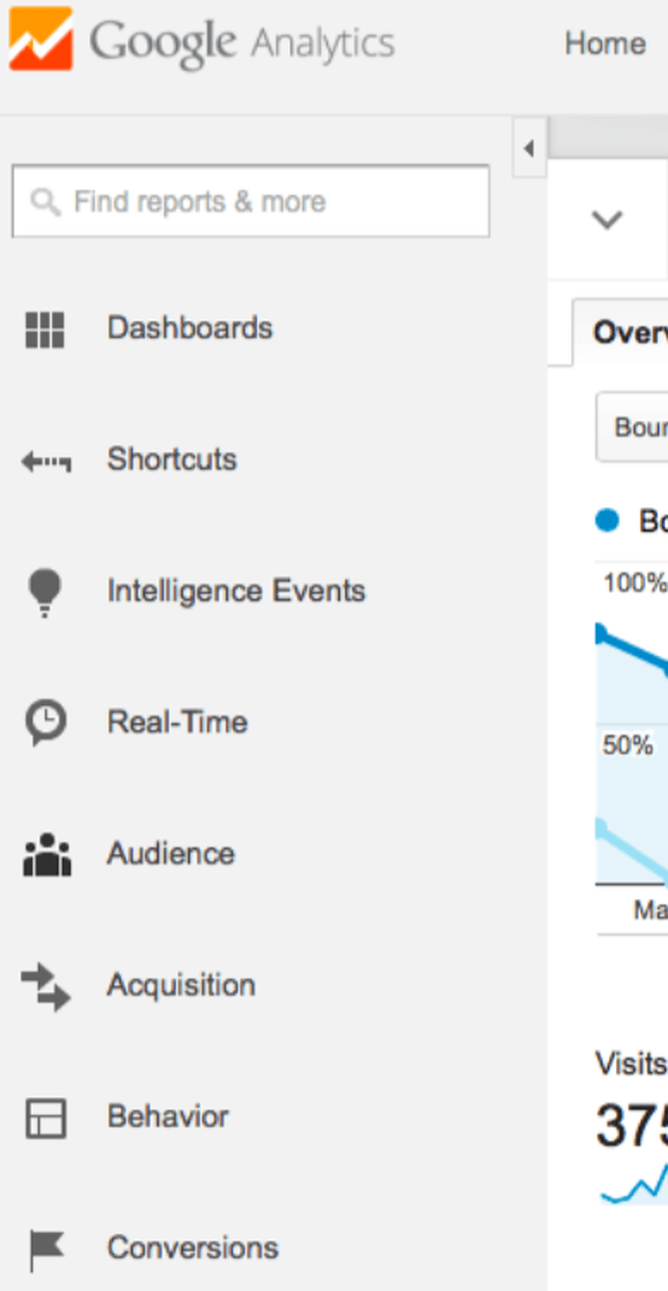
The first data you see when you log into Google Analytics is information about your audience, but don’t be fooled—Analytics is no one-trick pony. Besides audience information, Analytics offers a myriad of data types and tools. Just check out the sidebar located on the left-side of the page to see the different sections.
Dashboards
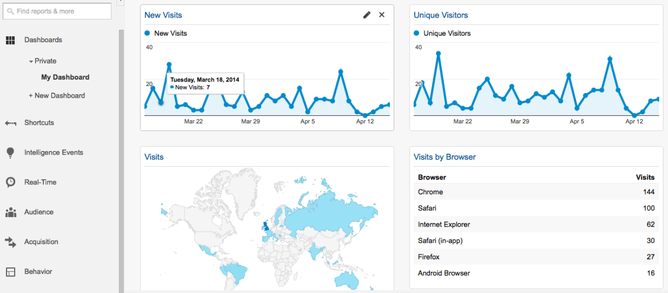
This is your quick-reference section. Data summaries, displayed as “widgets”, are viewable throughout Analytics, but Dashboards allow you to group your preferred widgets in one place. That means you can keep track of your most important data at a glance.
Shortcuts
Another time-saver. You can set up shortcuts to your go-to reports, including any filters etc. that you’ve applied to it. Then you can refer back to them any time with just one click.
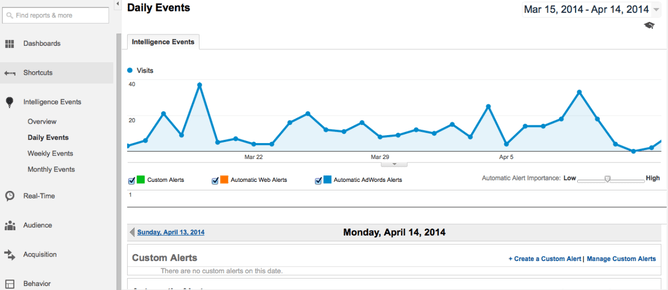
Intelligence Events
This section is all about alerts. Any time your data suddenly spikes or dips abnormally, Analytics alerts you to the fact. You can then take a look at the data and, with a bit of luck, figure out the reason for the anomaly. Some alerts are already set up for you, but you can also create your own customised alerts.
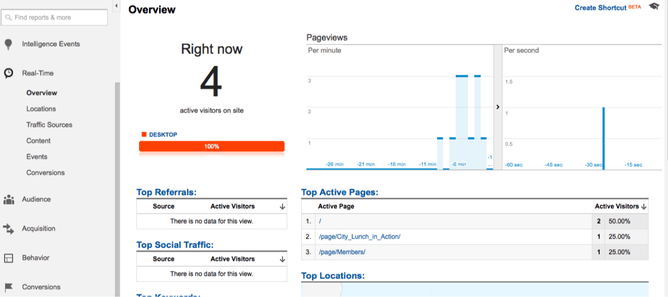
Real-Time
This is where you’ll find what’s happening with your website right now. Real time is more useful for high volume websites where there is potential for large spikes in traffic. Real time is especially helpful when tracking the impact of your social media activity or if you publish daily content and need to see what’s attracting the most attention.
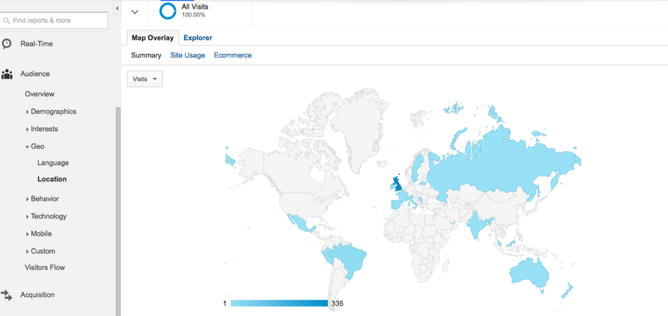
Audience
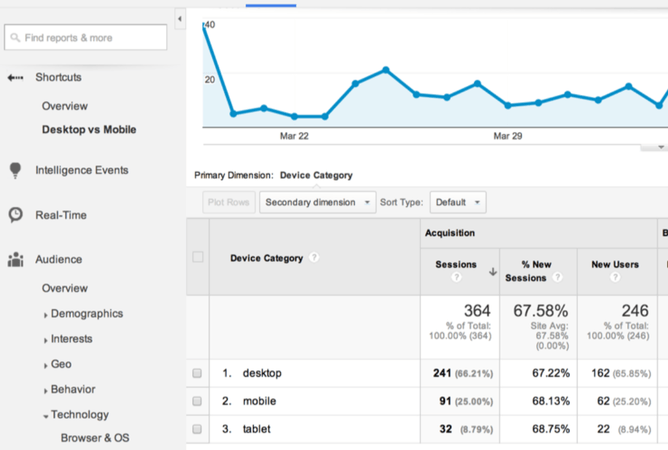
Who’s using your site? This section will tell you where in the world your visitors are located, what age demographics they represent, what kind of technology they’re using to view your site, and so on. You can even see how different demographics progress through your website.
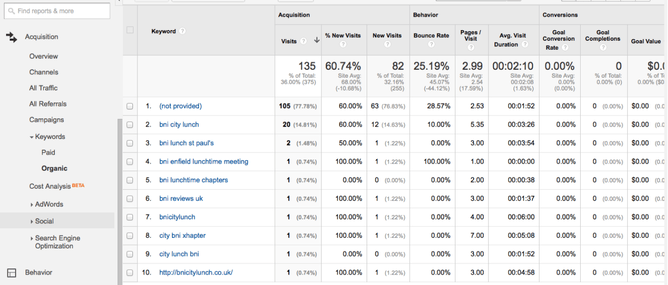
Acquisition
Sometimes it helps to know where on the web your traffic is coming from. In this section, you can find out how many visitors are coming from search engines, social networks, email campaigns and so on, so you know where to focus your promotional efforts. And if you’ve ever wondered what search queries your visitors are using to find you, this is where you’ll find the answer. This section also lets you monitor user engagement—how long they’re sticking around to read or view your content.
Behaviour
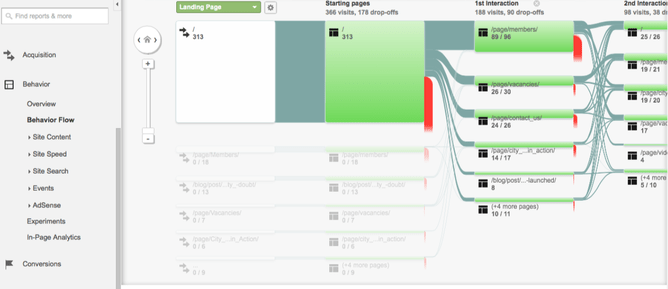
What do you site visitors do when they get to your site? This section has what you need to know about user behaviour, the most important being what pages they are visiting. The Behaviour Flow option lets you visualise how your visitors progress through your website and where they give up looking, allowing you to identify weak spots.
Conversions
This is where the rubber meets the road. Are your users actually doing what you ultimately hope they’ll do—buy your product, sign up to your e-newsletter, or download your program? This section is where you can set goals and monitor whether or not you’re meeting them.
How do I use Google Analytics?
Play with it. Just clicking around is, hands-down, the best way to learn how to use Google Analytics. The sheer amount of data collected coupled with the reminiscent-of-high-school-maths graphs can initially be overwhelming. But you’ll get over the initial shock just by spending some time exploring it yourself. You’ll soon find that it’s easy to use. So go ahead and play with it—you won’t break it!
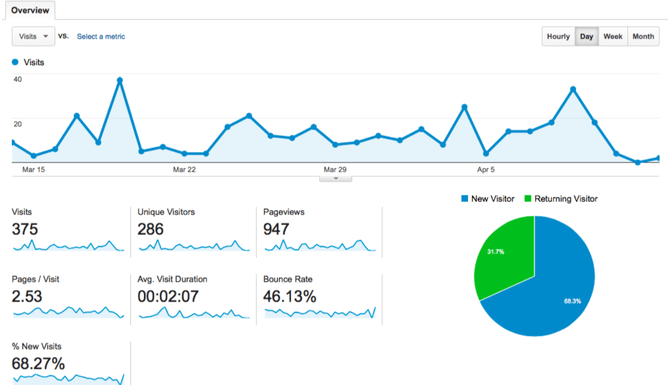
Even a cursory glance yields interesting insights. When you first log into Analytics (and entered “All Web Site Data”), the “Audience Overview” page is displayed by default. At the top, you’ll see a graph showing the number of visits per hour over the past month. Scroll down and you’ll see what percentage of those visitors were first-timers and returners. Next to that you can see helpful stats, like the average number of pages each user visits and the average length of visit. You can figure out all that useful information without clicking a button.
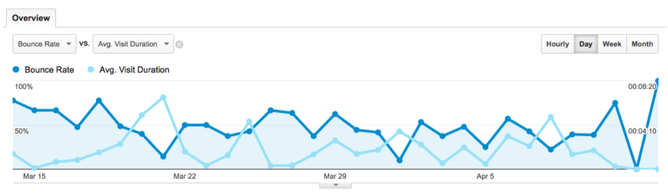
But once you start clicking, a world of data opens up to you. Click “Hourly” button in the top-right corner and you can instantly see all the same data but in hour-by-hour intervals to see what time of day you’re getting the most traffic. Or click on the “Visits” menu in the top-left corner and you can change it to another option like, say, “Bounce Rate” (that’s the percentage of users who leave immediately after visiting just one page). Then go to the adjacent “Select a metric” menu and choose something like “Avg. Visit Duration” and you can compare those two metrics side-by-side.
Click on the sidebar located on the left-hand side of the page and you can zero in on different kinds of data, as discussed in the previous section. And just by going through this sort of process—clicking around, trying different things out—you’ll get a feel for how Analytics works and what you can do with it.
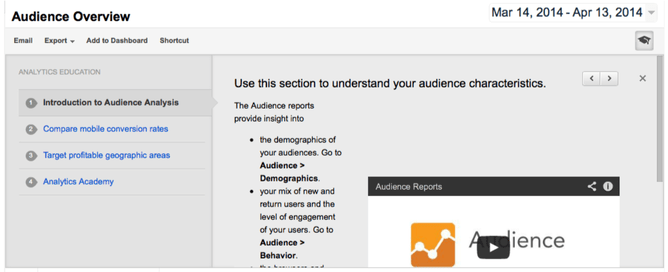
After your whistle-stop clicking tour through Analytics, it might pay to take a more methodical approach. At the top of the page for each section is an “Analytics Education” panel, that helps you go in-depth and get a fuller grasp of what you can discover through Analytics (if it’s not visible, click the mortarboard icon in the top-right corner to view it). Read through the bullet-point lists and watch the videos for the sections that you’re most interested in.
You can also get Analytics tips elsewhere. A quick Google search will turn up a whole host of blogs with handy hints on getting the most out of Analytics. For instance, you can find blogs with free downloadable dashboards.
Google Analytics is a data beast—there are tonnes of things you can learn from it. But even if you just use the most basic features, you’ll find it useful. That being said, the more you use it, the better you’ll get with it.
Conclusion
Big corporations pay big bucks for market research; Google Analytics is basically market research for your website, and you don’t have to pay a cent for it. And while it can be a bit daunting at first, you’ll quickly learn how to use it simply by playing around with it. Besides, what makes it a tad overwhelming—the volume of data—is also what makes it such a powerful tool for your business. So what are you waiting for? Sign up—you’ve got nothing to lose and a lot to gain. If you are a Rocketspark client here’s our user guide to set up Google Analytics